📗 Free template: Excel & Google Sheets
Free Inventory Spreadsheet Template for Excel and Google Sheets
Most small businesses start tracking inventory in a spreadsheet. It's free, everyone knows how to use it, and it's already on your computer. We built a ready-to-use template that does the math for you: stock in, stock out, on-hand quantity per location, and a reorder alert. Download it, then read on to see how it works and when a spreadsheet stops being enough.
Dropdown lists, multiple locations, stock in and stock out logs, stock by location, reorder status and a summary. No macros, no sign-up. Download it for Excel or LibreOffice, or make your own copy in Google Sheets.
1. What's inside the template
The template follows the classic inventory layout: a product list plus a log of every stock movement. You never type the on-hand quantity yourself. The spreadsheet calculates it from the opening stock and every receipt and sale. Made a mistake? Fix one row in the log and every total updates.
| Sheet | What it's for | What you fill in |
|---|---|---|
| Instructions | A short how-to | Nothing |
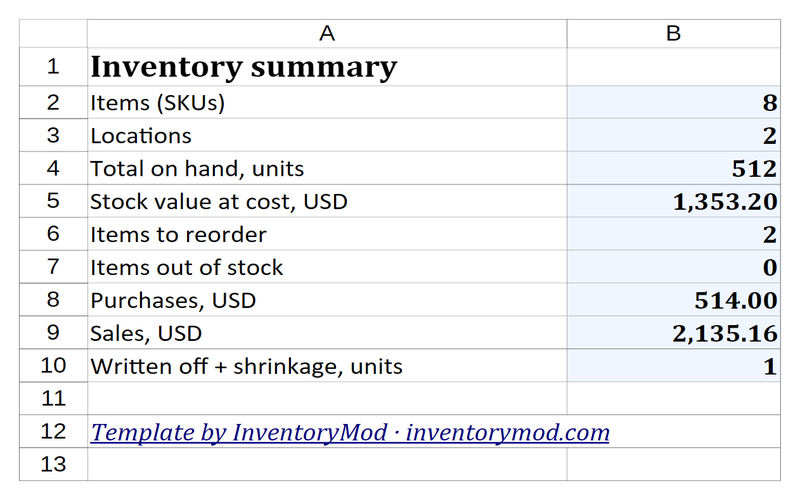
| Summary | Key numbers: item count, total units on hand, stock value, purchases, sales, items to reorder | Nothing, it's all calculated |
| Lists | Values for the dropdowns: locations, categories, brands, units, suppliers, customers, stock-out types, currencies with their rate to USD | Your own values, one per row |
| Products | Your item master and total stock across all locations | SKU, name, category, brand, barcode, cost, price, reorder point, opening stock |
| Stock by Location | A grid of item × location: how much of what sits where | Nothing, it's all calculated |
| Stock In | Log of everything received | Date, SKU, quantity, unit cost, location, supplier, PO or invoice number |
| Stock Out | Log of sales, write-offs and transfers | Date, SKU, quantity, price, location, type, customer |
Blue columns hold formulas, so leave them alone. When an item drops below its reorder point, the row turns red and its status changes to "Reorder" or "Out of stock".
2. How to use the template
- On the Lists sheet, replace the sample values with your own locations, categories, brands, suppliers and customers.
- On the Products sheet, delete the sample rows and add your items. Fill in the white columns only.
- Log every delivery as a new row on the Stock In sheet. SKU, location and supplier come from dropdowns.
- Log sales and write-offs on the Stock Out sheet, with a location and a type.
- Record a transfer between locations as two rows: out of one location, into the other.
- Check total stock on Products and stock per location on Stock by Location. Red rows marked "Reorder" need a purchase order.
- See the big picture on the Summary sheet.
Add new rows right under each table: it grows automatically and the formulas follow. Each step is covered in detail below.
Step 1. Fill in the lists
The Lists sheet holds eight lists: locations, categories, brands, units, suppliers, customers, stock-out types and currencies. Replace the samples with your own values. To add one, type it in the row right under the list and it shows up in the dropdown straight away.
Why bother? When people type categories by hand, you end up with "Drinkware", "drinkware" and "Drinkware " with a trailing space. Filters and totals treat those as three different categories. A dropdown makes that impossible.
A note on currencies. If you buy some stock in euros or yuan, enter the rate to USD in the list. The template converts every amount to dollars, so stock value and the Summary stay correct. There's one rate per currency: change it and past transactions are recalculated too. If you need the exact rate on the day of each delivery, that's a job for inventory software.

Step 2. Add your products
Each row on the Products sheet is one item. The most important field is the SKU. It must be unique and never change, because that's how receipts and sales find their item. A category prefix plus a number works well: DRK-001, CUT-014. Pick the category, brand, unit and cost currency from the dropdowns.
For opening stock, enter what's physically on the shelf the day you start. Count it, don't guess. The template assigns opening stock to the first location in your Lists sheet. If the item is already spread across several locations, enter the full amount there and record a transfer for the rest.
The reorder point is the quantity at which you should place a new order so you don't run out before it arrives. A simple formula: average daily sales × lead time in days + safety stock. Say you sell 5 mugs a day, your supplier takes 3 days to deliver and you want a buffer of 5. Your reorder point is 20.

Step 3. Log deliveries on Stock In
Enter each line of a delivery as its own row. SKU, currency, location and supplier come from dropdowns, so typos are out and the item name fills in by itself. Add the PO or invoice number too. You'll thank yourself when reconciling with the supplier.

Step 4. Log sales and write-offs on Stock Out
Anything that reduces stock goes here: sales, shipments, damaged goods, shrinkage, returns to a supplier. Every row has a type, and a customer is only needed for sales. That split lets the Summary report revenue and losses separately.
Lots of small retail sales? One row per item per day is enough.

Step 5. Transfer stock between locations
In a spreadsheet, a transfer takes two rows. On Stock Out, pick the source location and the type "Transfer". On Stock In, pick the destination and the supplier "Internal transfer". Set the price to 0 so the move doesn't count as a purchase or a sale.
Always enter both rows. Forget the second one and the stock disappears from one location without showing up at the other.
Step 6. Check stock levels and the summary
The Stock by Location sheet shows how much of each item sits at each location. Location names come from the Lists sheet, with room for five. A negative number turns red, which usually means a receipt or a transfer was never logged.
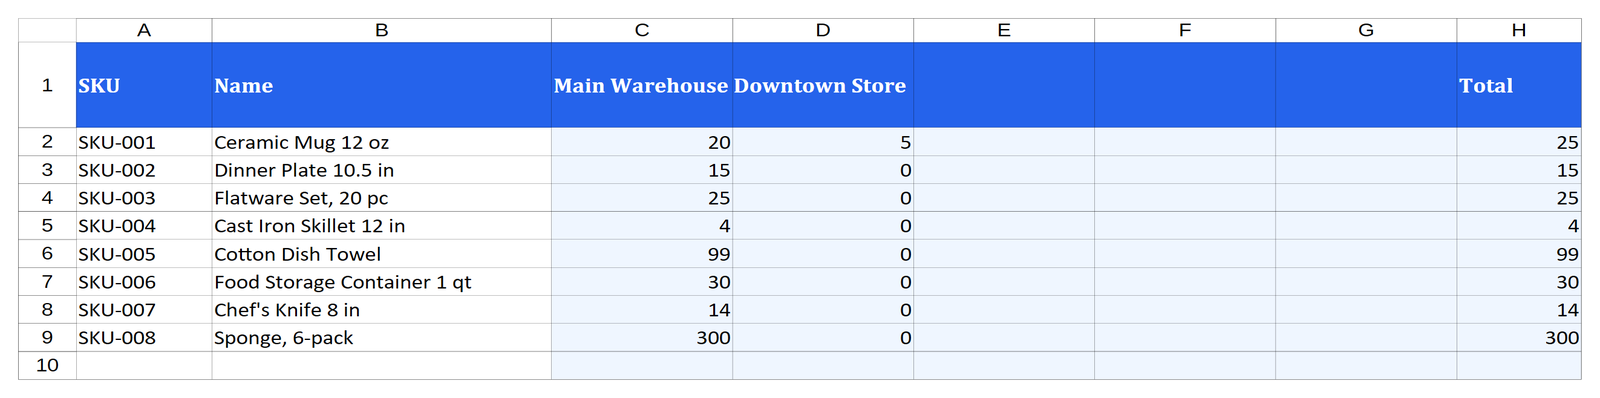
For a purchase list, filter the Status column on the Products sheet to "Reorder".
Step 7. Count your stock once a month
Count each location separately and compare with the Stock by Location sheet. Log any surplus as a row on Stock In and any shortfall as a Stock Out row with the type "Shrinkage". Never overwrite old numbers after the fact. You'll lose the history and never find out where the difference came from.
3. The template in Google Sheets
The same template is available as a Google Sheet. Click the button below and Google will offer to make a copy in your Drive. Nothing to download, and the copy is yours alone: we can't see it or change it.
📄 Make a copy in Google Sheets
Everything works just like in Excel: formulas, dropdowns, highlighting, stock by location. Reasons to pick Google Sheets:
- Team access. Share it with your stockroom and sales staff, and everyone works in one sheet instead of their own copy.
- Mobile. The Google Sheets app lets you log a delivery right in the stockroom.
- Autosave and version history. The file can't get lost, and you can restore an older version under File → Version history.
There's a catch. With several people editing, nothing stops someone from deleting a row or breaking a formula by accident. And there's no per-transaction audit trail like in real inventory software.
4. The formulas behind it
The template runs on a handful of formulas. Once you understand them, it's easy to adapt the sheet to your business.
| Column | Formula (row 2) | What it does |
|---|---|---|
| Stock in | =SUMIFS('Stock In'!D:D, 'Stock In'!B:B, A2) | Adds up everything received for this SKU |
| Stock out | =SUMIFS('Stock Out'!D:D, 'Stock Out'!B:B, A2) | Adds up all sales and write-offs |
| On hand | =K2+L2-M2 | Opening stock + stock in − stock out |
| Stock value, USD | =N2*H2*VLOOKUP(G2, Lists!O:P, 2, FALSE) | On hand × cost × currency rate to USD |
| Stock at a location | =SUMIFS('Stock In'!D:D, 'Stock In'!B:B, A2, 'Stock In'!I:I, C$1) − SUMIFS('Stock Out'!D:D, 'Stock Out'!B:B, A2, 'Stock Out'!I:I, C$1) | The same, filtered by location (Stock by Location sheet) |
| Status | =IF(N2<=0, "Out of stock", IF(N2<J2, "Reorder", "In stock")) | Reorder alert |
On the log sheets, the item name comes from =IFERROR(VLOOKUP(B2, Products!A:B, 2, FALSE), "- unknown SKU -"). See "unknown SKU"? The item isn't on the Products sheet yet, or the SKU has a typo.
=SUMIFS('Stock In'!D:D, 'Stock In'!B:B, A2, 'Stock In'!A:A, "<="&$R$1), then put the date you want in cell R1.5. How to build your own
Building one from scratch? Three rules matter more than any formatting.
- Keep the item list and the movements separate. On-hand quantity is a result, not an input. If you overwrite it in a single cell, sooner or later it won't match the shelf.
- Use Excel tables. Insert → Table, or Ctrl+T. New rows are picked up by formulas and filters automatically.
- Validate input. Data → Data Validation: SKU only from the product list, quantity only greater than zero. That stops most typos before they happen.
For the red highlight, go to Home → Conditional Formatting → New Rule and use the formula =$N2<$J2.
6. Common spreadsheet inventory mistakes
- One item, many names. "Mug 12oz" and "Ceramic mug, 12 oz" are two different items as far as Excel is concerned. SKUs and dropdowns fix that.
- Editing stock by hand. Quick, but a month later nobody can say where 12 units went.
- Multiple copies of the file. "inventory_new.xlsx" and "inventory_new_FINAL2.xlsx" on two computers. Nobody knows which one is right.
- No backup. The file gets deleted or overwritten, and the history is gone.
- Logging "later". Invoices pile up for a week, and the on-hand numbers are wrong the whole time.
7. When you outgrow a spreadsheet
With a small catalog and one person keeping the file, a spreadsheet does the job. These are the points where it starts getting in the way:
| Task | Spreadsheet | Inventory software |
|---|---|---|
| Multiple warehouses or stores | Possible, but each transfer takes two rows and it's easy to miss one | Stock per location, transfers in a single step |
| Reserving stock for a customer order | Manual, easy to sell what's already promised | Reservations reduce available stock automatically |
| Purchase orders and receiving | A separate sheet, receipts typed in twice | Receiving against a PO creates the stock entry |
| History and undo | Only Ctrl+Z while the file is open | Full movement log, mistakes can be reversed |
| Working from a phone on the floor | Awkward | Mobile app |
| Teamwork | File copies and conflicting edits | One shared database |
| Buying in foreign currencies | One rate for the whole file: change it and past receipts change too | Price and currency stored with each transaction |
What usually keeps people in spreadsheets is the belief that inventory software is expensive, slow to set up and wants you to create an account. That's exactly why we built InventoryMod, a free inventory management system. No sign-up, no credit card, no feature limits. Your data stays on your device, not on someone else's server. It runs in the browser, as a Chrome extension (offline too) and on Android.
8. Moving your data into an app
The columns on the Products sheet match the product fields in InventoryMod, so you don't have to retype your catalog.
- Open the web app or add the Chrome extension. No sign-up needed.
- Go to Import / Export, choose the Products model and upload the file. You can also paste rows copied straight from Excel.
- Check how the wizard mapped your columns. Missing categories and brands are created for you.
- Run the dry-run check. It shows which rows are ready and which have errors.
- Import stock per location: create locations with the same names, then choose the Stock model, the Snapshot operation, the location, and the SKU column plus that location's column from the Stock by Location sheet.
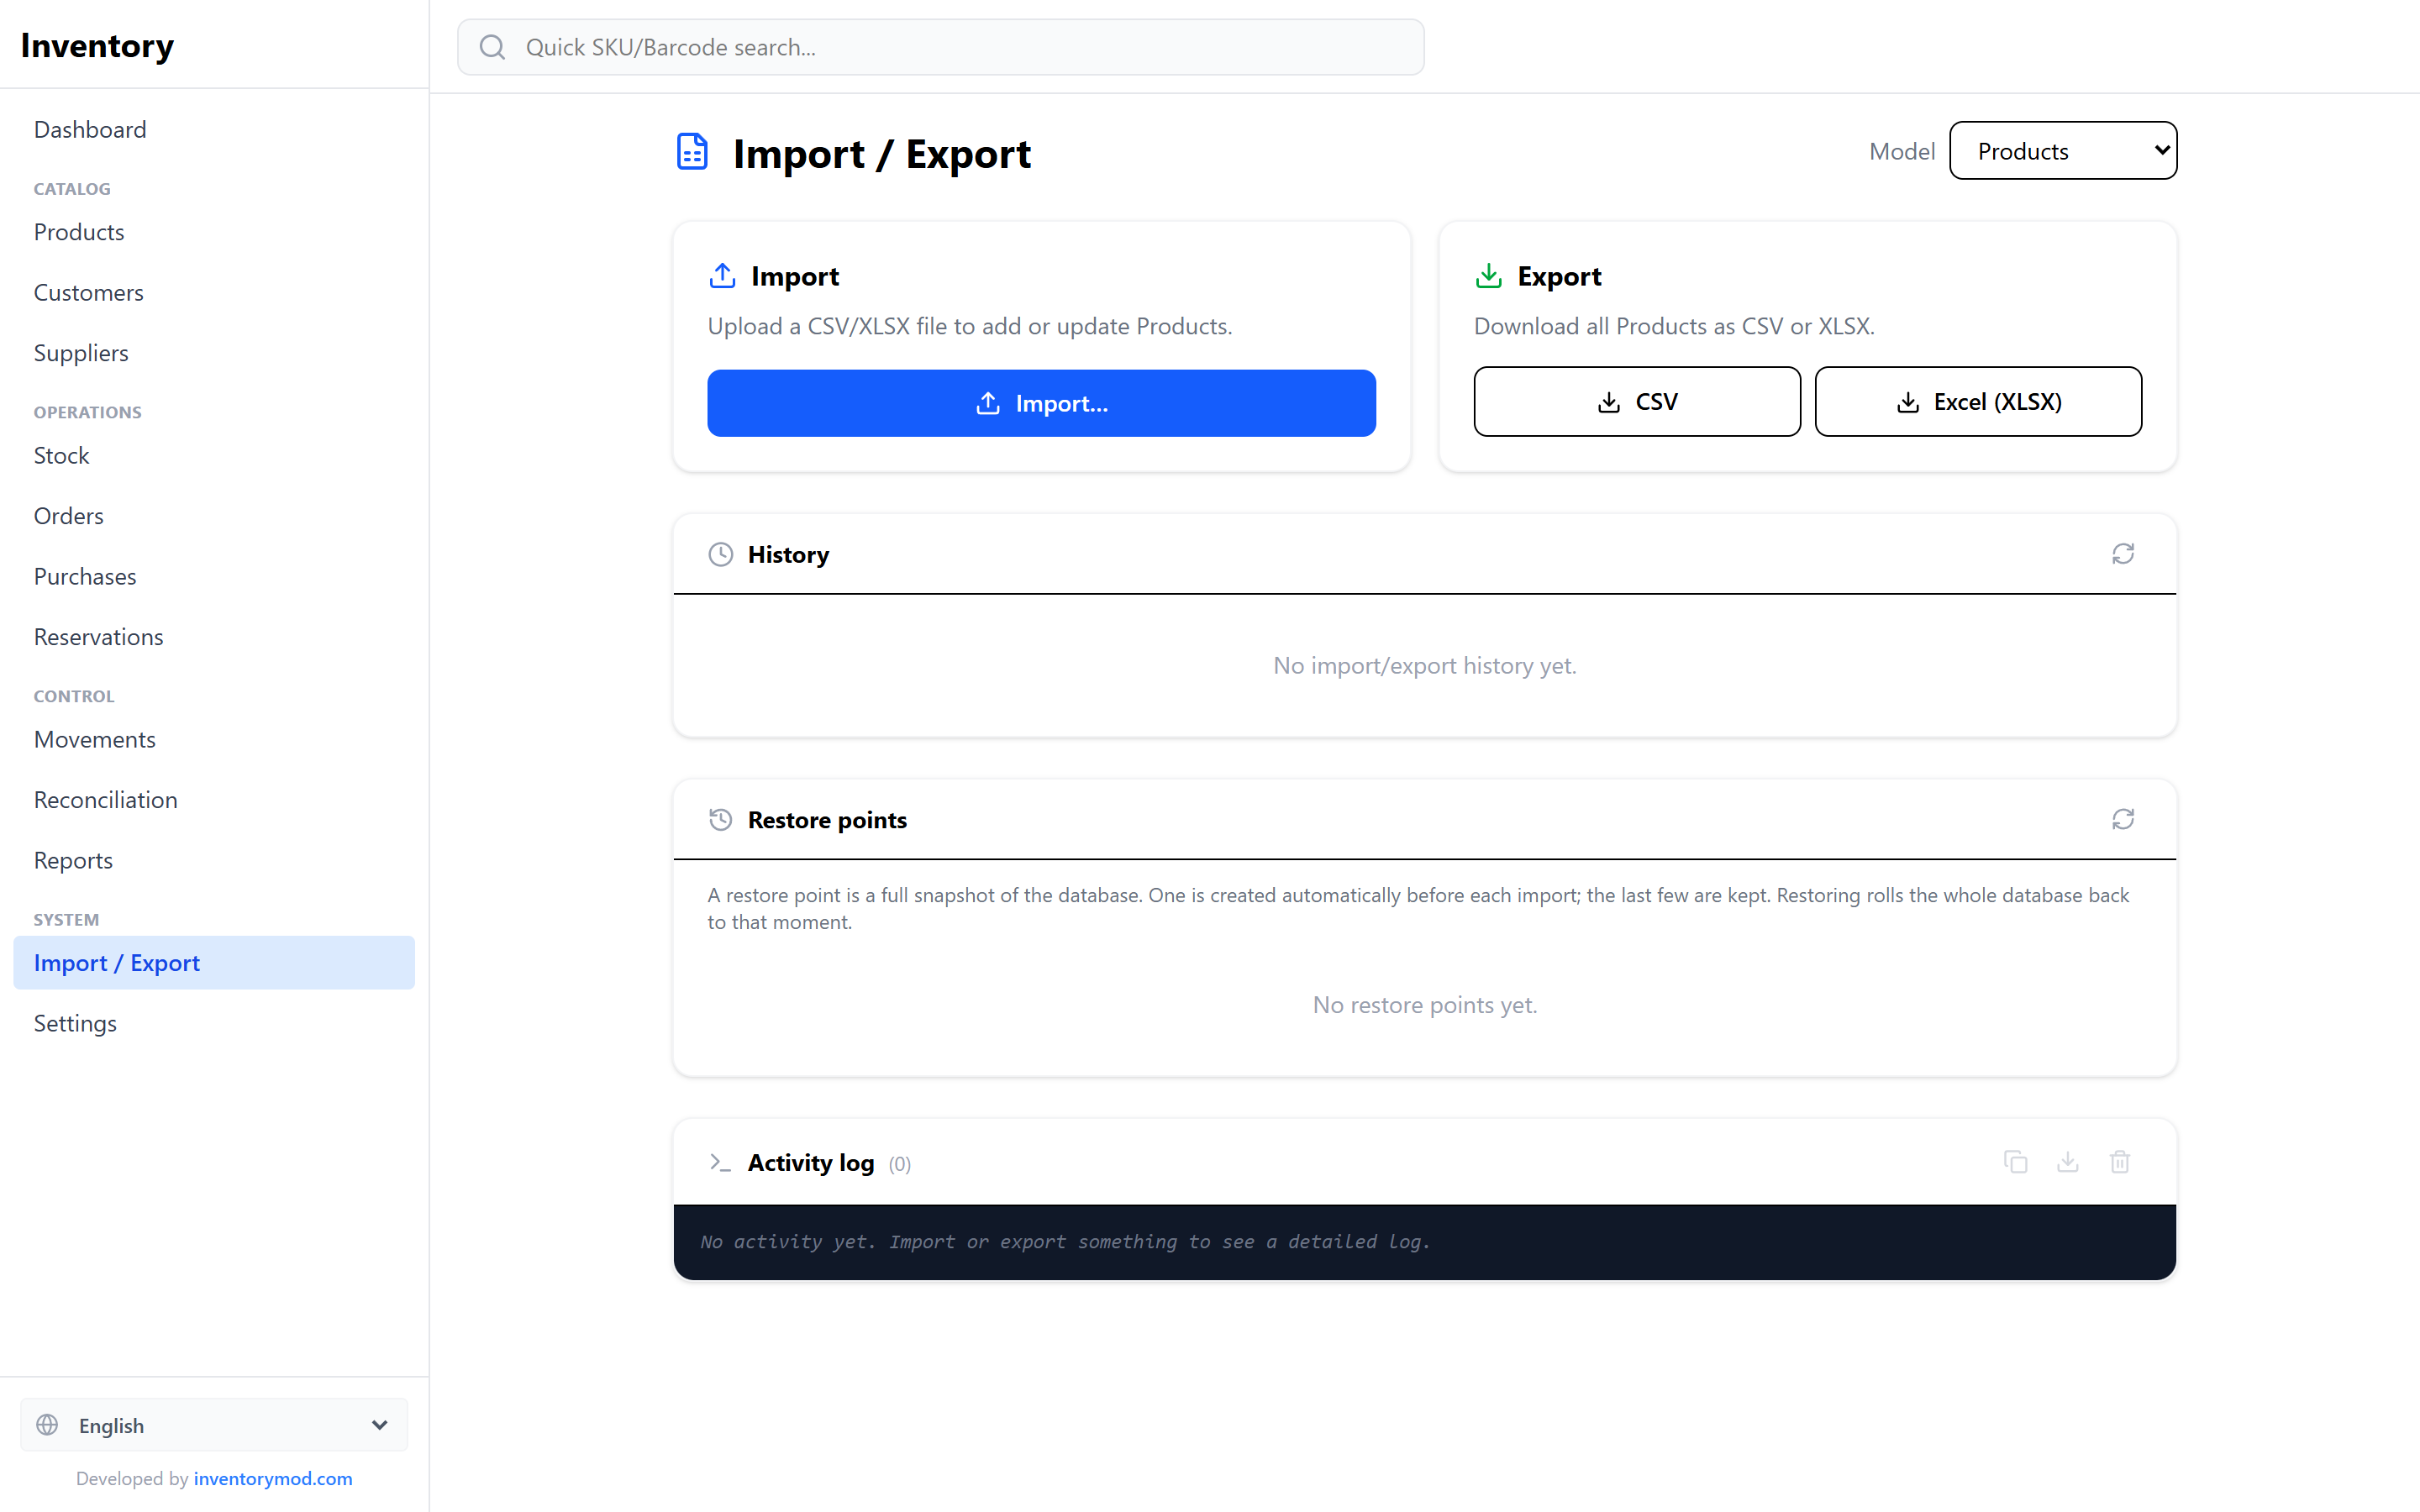
You can undo an import, and you can export everything back to Excel at any time. More in the docs: import and export, warehouses, stock movements, stock reconciliation.
9. FAQ
Is there a free inventory template for Excel?
Yes. The template on this page is free and has no macros. Download it for Excel or LibreOffice Calc, or make a copy in Google Sheets.
How do I calculate stock on hand in Excel?
Opening stock plus everything received minus everything sold or written off. SUMIFS adds up receipts and sales by SKU. The template already has this set up.
Does the template work in Google Sheets?
Yes, there's a ready-made version. Make a copy in Google Sheets in one click, and the formulas, dropdowns and highlighting already work.
How do I track inventory across multiple locations in Excel?
The template already does it. Every transaction has a Location column, and the Stock by Location sheet shows on-hand quantity per location. The one drawback: a transfer takes two rows, out of one location and into another. With lots of transfers, software that does it in one step is easier.
How many items can I track in a spreadsheet?
Row limits aren't the issue for a small business. The real problems are slower recalculation once you have thousands of SUMIFS formulas, and the awkwardness of several people editing one file.
Why use an app if the spreadsheet is free too?
You get reservations, multiple locations, purchase orders with receiving, a full history with undo, a mobile app and offline mode. InventoryMod needs no sign-up, and you can export everything back to Excel whenever you like.
Outgrowing your spreadsheet?
Import the template into InventoryMod. Free, no sign-up.